Super Bowl Point Spread Trends: By Favorites vs. Underdogs, Passing/Rushing Stats & More
Do more favorites or underdogs cover the Super Bowl point spread? Does good defense or offense win more against the spread? Here’s the data.
January 31, 2024 – by Jason Lisk
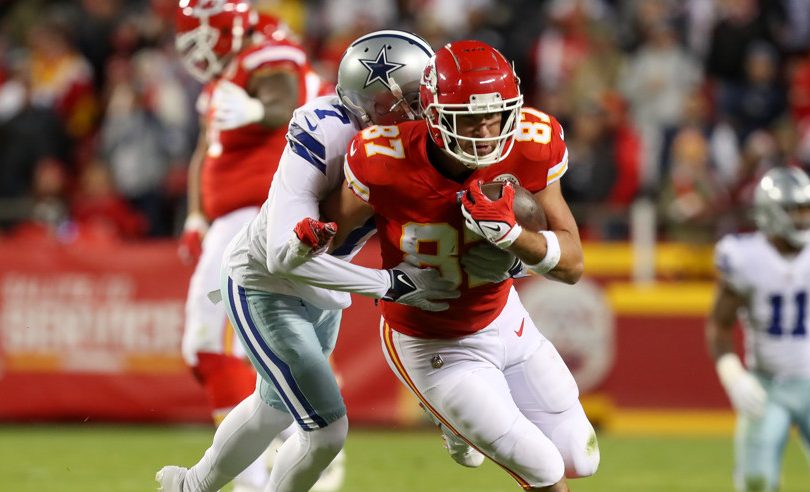
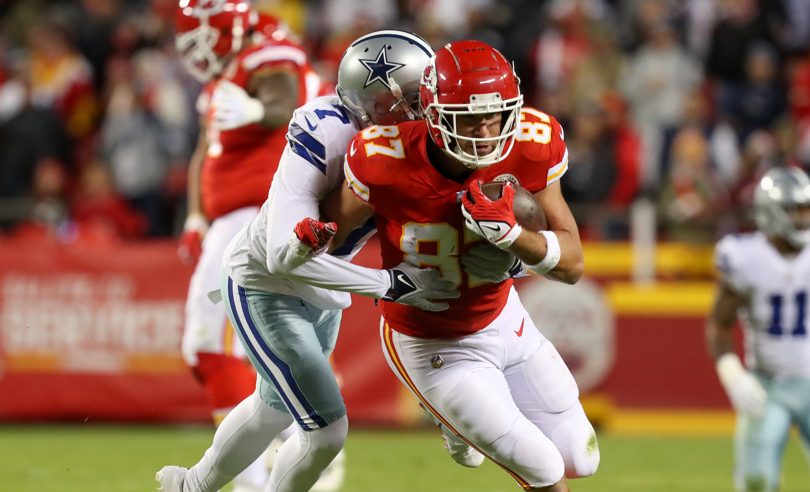
Travis Kelce is part of an efficient Chiefs offense (Scott Winters/Icon Sportswire)
In this post, we’ll look at some historical data trends regarding teams that have covered the Super Bowl point spread.
While you always need to be cautious when it comes to trend-based analysis, this information can be helpful for making an against the spread pick for Super Bowl LVIII in 2024, featuring the Kansas City Chiefs against the San Francisco 49ers.
Analysis Of Historical Super Bowl Point Spread Trends
The trends we will investigate include:
How Super Bowl favorites and underdogs have performed against the spread.The ATS (against the spread) performance of Super Bowl teams based on their win/loss record, playoff seeding, and other regular-season traits.How teams performed straight up and ATS when they had passing efficiency advantages on offense and defense.Super Bowl point spread records based on stats like how teams ranked in third-down and fourth-down conversion rates, field-goal percentage (for and against), punting, and touchbacks.
We will also include notes about how these trends relate to this year’s Super Bowl LVIII matchup between the Chiefs and 49ers.
Super Bowl Point Spread Trends: Favorites vs. Underdogs
Here’s a look at how the favorites and underdogs have performed both straight up and against the spread since the 1995 season in the Super Bowl, with some observations below:
| Category | SU W | SU L | SU PCT | ATS W | ATS L | ATS T | ATS PCT |
|---|---|---|---|---|---|---|---|
| Favorites | 16 | 12 | 57.1% | 9 | 17 | 2 | 35.7% |
| Underdogs | 12 | 16 | 42.9% | 17 | 9 | 2 | 64.3% |
| AFC Favorites | 11 | 7 | 61.1% | 8 | 10 | 0 | 44.4% |
| NFC Favorites | 5 | 5 | 50.0% | 1 | 7 | 2 | 20.0% |
| Favored by 3 or less | 6 | 4 | 60.0% | 6 | 4 | 0 | 60.0% |
| Favored by 3.5 to 6 | 2 | 5 | 28.6% | 1 | 6 | 0 | 14.3% |
| Favored by 6.5 or more | 8 | 3 | 72.7% | 2 | 7 | 2 | 27.3% |
Super Bowl underdogs have covered more frequently than favorites.The only NFC favorite to cover in the last 28 years was Green Bay in the 2010-11 season (as a 3-point favorite against Pittsburgh).Improbably, small favorites of a field goal or less have won outright at a higher rate than larger favorites, as the Super Bowl has seen plenty of big upsets in the last 28 years.Teams favored by more than a field goal are only 3-13-2 ATS in the Super Bowl since 1995.
2024 Notes
As of Wednesday, January 31st, the 49ers are a 2-point favorite at most books.
Super Bowl Point Spread Trends: Team Record and Other Characteristics
Here is how Super Bowl teams performed based on relative win/loss record and where they were seeded in their conference at the start of the playoffs:
Subscribe now to read the rest…
Plus get picks and tools for sports betting and pools.
Subscribe Now
Free access offers available
Already a premium subscriber? Sign in for access
NFL PredictionsNFL TrendsNFL OddsNFL MatchupsNBA PredictionsNBA TrendsNBA OddsNBA MatchupsMLB PredictionsMLB TrendsMLB OddsMLB MatchupsNCAAF PredictionsNCAAF TrendsNCF OddsNCAAF MatchupsNCAAB PredictionsNCAAB TrendsNCB OddsNCAAB Matchups A product ofTeamRankings BlogAboutTeamJobsContact
© 2005-2024 Team Rankings, LLC. All Rights Reserved. Statistical data provided by Gracenote.
TeamRankings.com is not affiliated with the National Collegiate Athletic Association (NCAA®) or March Madness Athletic Association, neither of which has supplied, reviewed, approved or endorsed the material on this site. TeamRankings.com is solely responsible for this site but makes no guarantee about the accuracy or completeness of the information herein.
Terms of ServicePrivacy Policy


